The whole world today is struggling with the menace of COVID-19. The pandemonium has taken around 197 countries into its fold as on today. The governments all around the world are making great efforts to contain the spread of Corona virus. Meanwhile here is the explanation of the spread of the virus through some of the graphs and also humble and fallible attempt of projections of its spread in India in future.
Before starting, some caveats regarding the data is necessary: - The data used is taken from The daily situation reports of WHO. Though there can be many arguments regarding WHO's data transparency and it's controversial role in COVID-19, there is no parallel organization to pool the data from, for countries across the world. Also sometimes there are some typos/compilation errors/ reporting errors in data in the situation reports which are omitted to avoid the wrong deviations in the graphs.
So as the number of cases in different countries varies largely and all the countries are said to be in different phases (phase-1/2/3 etc) of the spread in different timelines, I have preferred the 'percentage change in number of cases on day-to-day basis' as the criteria for cross country comparison.
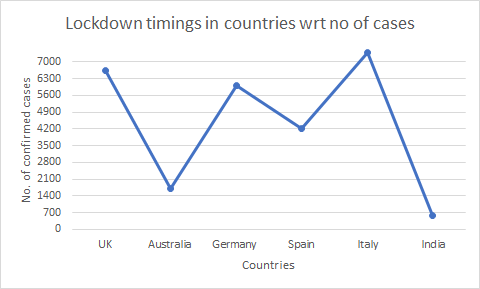
As we all know that ensuring social distancing is the most important solution for containing the spread of COVID-1, many countries have resorted to nationwide 'lockdown'. But the scale, extent and timing of lockdown has been quite varied as can be seen from following graph-
As we all know that ensuring social distancing is the most important solution for containing the spread of COVID-1, many countries have resorted to nationwide 'lockdown'. But the scale, extent and timing of lockdown has been quite varied as can be seen from following graph-
 |
| Graph-1 |
As can be seen from the graph except India all countries have announced lockdown only after number of confirmed cases have crossed 1500. UK, Italy have declared it only after number rises beyond 6000. Also the extent of lockdown in different countries is different like complete lockdown in some and partial in some others. India has taken a right decision of complete lockdown when the number of cases were around 600 only. Therefore this is the first important measure by India to manage COVID-19 in the "lower bracket".
WHO started giving its daily situation reports from 21st January only though the outbreak in China has reportedly started much before that. So Initially many of the countries were unaware or were not recognizing its gravity. Therefore the reported numbers were also quite less as the rigorous testings were not started in many of the countries. With this pretext, let us now compare the trend of number of cases in India vis-a-vis those in other countries.
India vs. USA-
As on today if we see, there is huge difference in number of cases in India compared to those in USA. But initially till 6th March difference was merely of around 100 cases with USA leading. Also roughly the fluctuating trend in percentage growth of cases on day to day basis is nearly similar with India still trading in much lower brackets.
 |
| Graph-2 |
As said earlier, the initial data of number of cases in all the countries except China might be misleading as the systems for COVID19 were either not in place or were not fully functional.
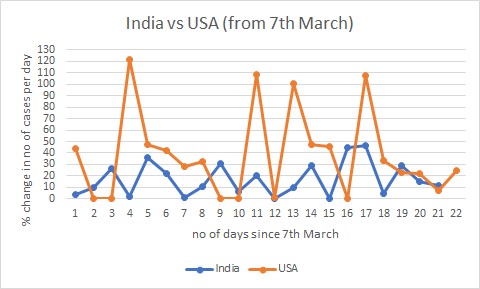
It will be interesting to look at the above trend by zooming in the selected area which focuses on the period from 7th March as the fluctuations from then onwards are quite significant and also the countries were geared up by then.
 |
| Graph-3 |
As can be seen the percentage change in number of cases on day on day basis is quite large in case of USA. But what is similar for both USA and India is constant fluctuations in the trend. Many statistical models suggest the comparison feasible between such trends which have similar trend, the fluctuation in this case. Though the similarity in the trend is fluctuations, the striking fact is that India is again in the lower bracket here as well.
e.g consider the average of percentage change from 4th day (i.e from 10th March) to 7th day (i.e. upto 13th March). For USA average comes to 59.72 and for India it is 15.42. And this is true for any time duration.
 |
| Graph-4 |
Same is the case of comparison between India and Spain as can be seen in the graph above. India is trading again in the lower brackets in terms of percentage change/increase in number of confirmed cases compared to that of Spain.
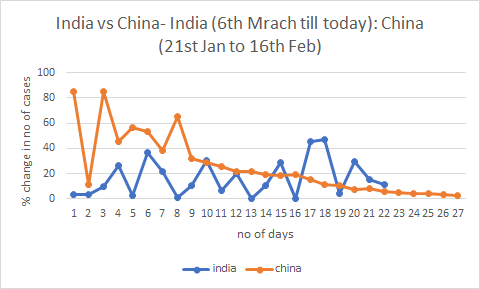
Another interesting study which again highlights that India in any case is hovering only in the lower bracket only is the comparison of percentage change of cases on day to day basis between India and China.
 |
| Graph-5 |
Significance of these dates is necessary to understand. As stated earlier, WHO started its daily situation report only on 21st January though the outbreak is said to have existed for more than a month prior. So for China we have started from 21st January. From 21st January, the trends are quite fluctuating and much of the ups and downs can be seen. But, as per the Situation Reports data, the percentage change in number of cases started showing strong declining trend from 16th February. Therefore this period between 21st January to 16th February is selected. Now for comparing two countries, it was essential to select such period for India as well which was showing similar fluctuating trend initially and declining trend later.
Now in cases of India, the span is very short to assertively say that there are strong declining trends. But with whatever data available, with the intensity of measures taken, it can be said that the similar period showing fluctuations initially but decline at the end is between 6th March to 29th March. But it must be highlighted here that decline in the percentage change does not imply that the actual number of cases will start declining or number of new cases will be lesser than the previous day.
e.g. Consider on Day-1 number of cases -100
If there is 20% increase, then Day-2 number of cases will be - 120 (So new cases- 20)
Now suppose on Day-3 increase is by 19%, then number of cases- 142.8 (So new cases -22.8)
So it is clearly seen that percentage decline in number of cases does not 'necessarily' means decline in number of absolute cases. this is obviously because of bases effect.
Therefore now let's understand the implications of the above Graph-5. China has taken around 16 days to bring the percentage change below 1% from the figure where India is on 28th March. Data shows that South Korea has taken around 11 days to bring percentage change below 1% from the figure where India is on 28th March. If India is able to bring the percentage change in number of cases to below 1% within next around 12 to 15 days, I think that will be really wonderful achievement nonetheless.
There are certain advantages to India in this-
1. The daily percentage changes have not seen much major spikes as in case of other countries.
2. The actual number of cases are also comparatively lesser compared with China, USA, Italy etc. Therefore the base effect will also be in India's favor.
3. India is also trying to reap benefits of late starter. Learning from others and accordingly devise the strategy will certainly help.
4. Many ideological debates over the curfews, complete lockdowns in many of the Western countries have actually delayed their decision making in this respect. Whereas India by and large has experienced political unity and solidarity at this time and Union and States are exhibiting excellent model of Federalism till now. This will certainly help in long run.
Therefore until now India, the continental size country, has managed quite well at this crucial time. But there are some issues which are challenging and need to manage promptly-
1. With complete lockdown in place, administration in other countries are focusing mainly on containment of COVID-19, supply chain management etc. Whereas Indian administration is overburdened with the disease related work and apart from that also the work related to managing mass migration, arrangements of food, shelter etc for migrants. This is absolutely necessary in country like India but at the same time it must be ensured that this by any way does not compromise the focus on disease containment.
2. It is now quite established fact that elderly are more prone to COVID19 and also mortality rate is higher in elderly population. With strong family system in place, many Indian families have 3 generations staying together- grandparents, son and grandchildren. This increases the vulnerability and the risk of spread and mortality as well. Personal hygiene and social distancing even within families is needed in such situations.
3. With large families residing in the smaller houses, social distancing or home quarantine becomes really challenging. Also contact tracing in the densely populated cities, slums etc demands urgent innovative solutions.
4. Health infrastructure, per capita availability of health professionals are some other challenges. Also per million tests carried out are also less compared to the other countries which needs to be ramped-up rapidly. Innovative solutions like isolation beds in the train coaches might help in such situations.
In the end it can be said that, going by current statistics, India will trade within lower brackets only and by and large will contain the pandemonium effectively.
Thank you, Akshay for such an insightful article. Your observations are interesting, especially the last part. 🙂
ReplyDeleteThank you for showing the interest. Best regards.
DeleteInsightful!
ReplyDeleteThank you Anand.
DeleteThis information is impressive; I am inspired with your post writing style & how continuously you describe this topic. I feel happy about it and I love learning more about this topic.
ReplyDeleteThird Party Pharma Manufacturers
Third Party Manufacturers